During my internship during the autumn semester of 2020 at the Machine Learning and Computational Biology lab at ETH Zurich under the supervision of Bastian Rieck, I have investigated how topology can be used to further our understanding of Alzheimer’s disease and wanted to provide a short introduction of my work here.
Topology, or how to study similarities between coffee mugs and doughnuts
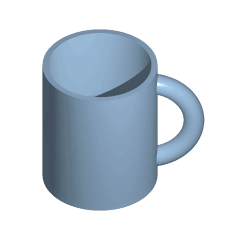
I’ll start with a quick introduction to topology, which is a field of mathematics concerned with the investigation of “properties of geometric objects under continuous deformations such as stretching, twisting, crumpling, and bending, but not tearing or gluing.” A quintessential example illustrating the types of statements proven using the topology theory toolkit is the fact that it is possible to obtain a coffee mug from a doughnut without ever breaking the surface the shape at any point, a relationship known as deformation, which is a type of homeomorphism, as seen below.
Although there are many, many more mathematically elegant proofs making use of topological concepts, we will concerns ourselves here with topological data analysis, a branch of topology concerning itself with the shape of data. Specifically, we will now discuss a method commonly used in topological data analysis, which is called persistent homology.
Persistent homology, or how to count and quantify the size holes in shapes
Persistent homology is a complex topic that took me some time to wrap my head around, and honestly, I still don’t think I understand it fully. However, the best introductions I have encountered on my path to learning topology is through illustrations. Take a look at the following animated picture:
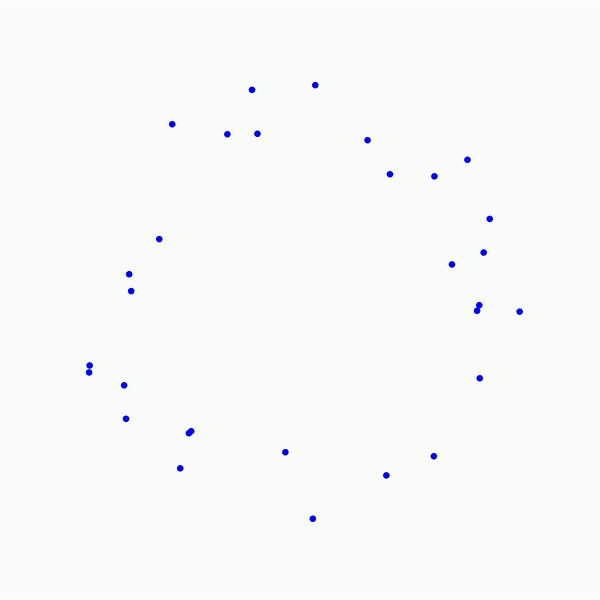
As you can see, this portrays a series of growing balls around each of the points, and a graph is built as each of the balls intersect. The objective of such a procedure is to uncover connected components (i.e., the graphs obtained as the balls grow), tunnels (here, the central void in the middle), and holes (in 3D, not shown here). These features can be more or less persistent. A feature is referred to as persistent if it lasts across a wide range of radii sizes, such as the 2D hole viewed in the center of the point cloud shown above. This process can easily be adjusted to various data types such as images, as we will see below. One term remains to be discussed here , though: what does “homology” in “persistent homology” mean? It is an abstract concept. However, for our purposes, we only need to define a homology dimension, which broadly defines the dimension of the topological features observed as we vary the size of the radii: connected components correspond to homology dimension 0, tunnels to homology dimension 1, and holes to homology dimension 2. This concept can be extrapolated to higher dimensions, but they become less meaningful for our purposes.
How can we adapt persistent homology to 3D spaces such as, say, cheese?
It is easy to imagine extrapolating the procedure detailed above to 3D spaces and different data types. Instead of looking at point clouds, we look at a collection of voxels, a fancy word for a 3D pixel. Instead of growing balls around each point, it is possible to take a function, which varies between the minimum and maximum value of the voxels in the observed image (say, 0 for an empty voxel and 1 for a dense voxel). If we take a 3D image of a typical Swiss cheese (like Emmental), a value of 0 would correspond to a spot in the cheese where there is a hole, and 1 to where there is actual cheese. It is possible to vary our function between those values and define two voxels as connected for this particular value of the function if both voxels are below said value. This process is called a cubical complex filtration procedure. The cubical complexes here refer to voxels and groups of voxels with values below a certain threshold, and the procedure of filtration stems from varying the threshold below which cubical complexes are formed over the range of all possible cubical complex value. Allow me to insert this illustration from my supervisor, Bastian Rieck, here to help visualize.
Notice how we now have three-dimensional topological features adapted to study the density of voxels!
Why and how can we apply cubical complex filtrations to Alzheimer’s disease
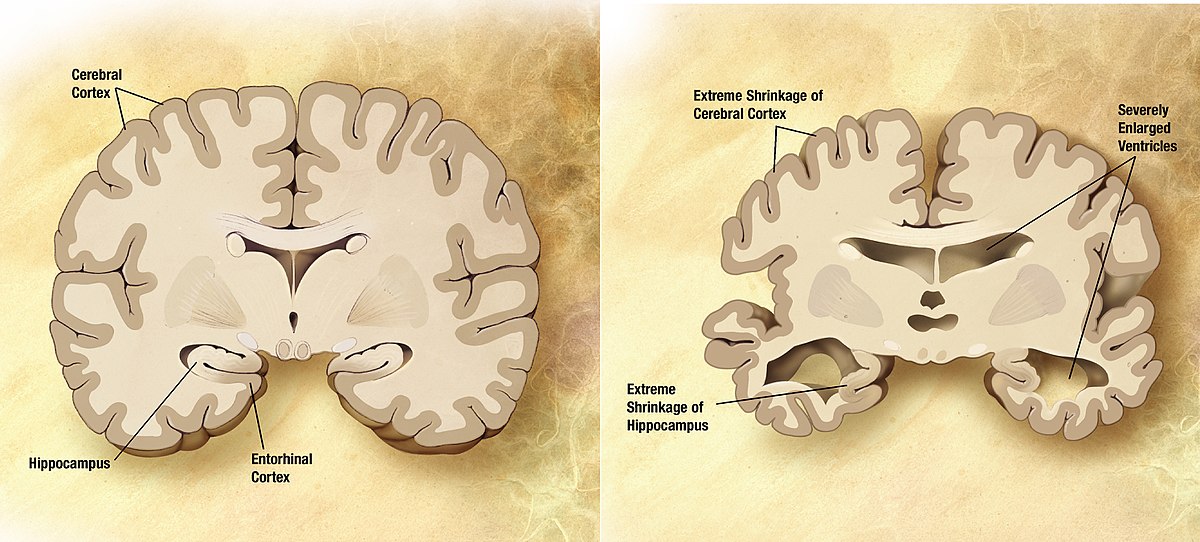
Alzheimer’s disease is a devastating neurological condition affecting 60 million people worldwide, a figure which increases as populations age. Finding a cure for such a disease will not only relieve each patient from much psychological pain but also alleviate an increasing burden on healthcare systems, which is projected to cost the US alone upwards of $7 trillion by 2030. Although the origins of the disease are still poorly understood, it is widely accepted that two proteins, amyloid-beta, and hyperphosphorylated tau proteins, essentially clog up brain tissue, activate inflammatory cells, both of which result in neuronal loss. This massive loss of neurons has an irreversible cumulative effect: brain atrophy, which refers to the crumpling of brain tissue and reduction of brain volume, as can be seen in the picture below.
By now, this might be obvious for some: how is it possible to quantify changes in brain shape due to Alzheimer’s disease?
… By using persistent homology!
This very question was the central question of my lab rotation topic. I followed the footsteps of my fellow colleagues and looked at a particular region of the brain significantly affected by Alzheimer’s disease, the medial temporal lobe, and performed several experiments with representations resulting from applying cubical complex filtrations to structural MRIs of ordinary people and patients affected by Alzheimer’s disease. It turns out persistent homology can preserve a lot of information useful for classification while being incredibly sparse!
To read more, head over to the GitHub repository of my lab rotation, where you will find my written report as well as the code I used in my analyses.
Acknowledgments
I would like to thank Bastian Rieck for the supervision, Catherine Jutzeler and Sarah Brüningk for helpful discussions, and Karsten Borgwardt for providing the research environment. Lastly, I would like to thank the developers of giotto-tda for their excellent work, which I heavily leveraged in this project.